The Hunting ELK (HELK)
Contents
The Hunting ELK (HELK)#
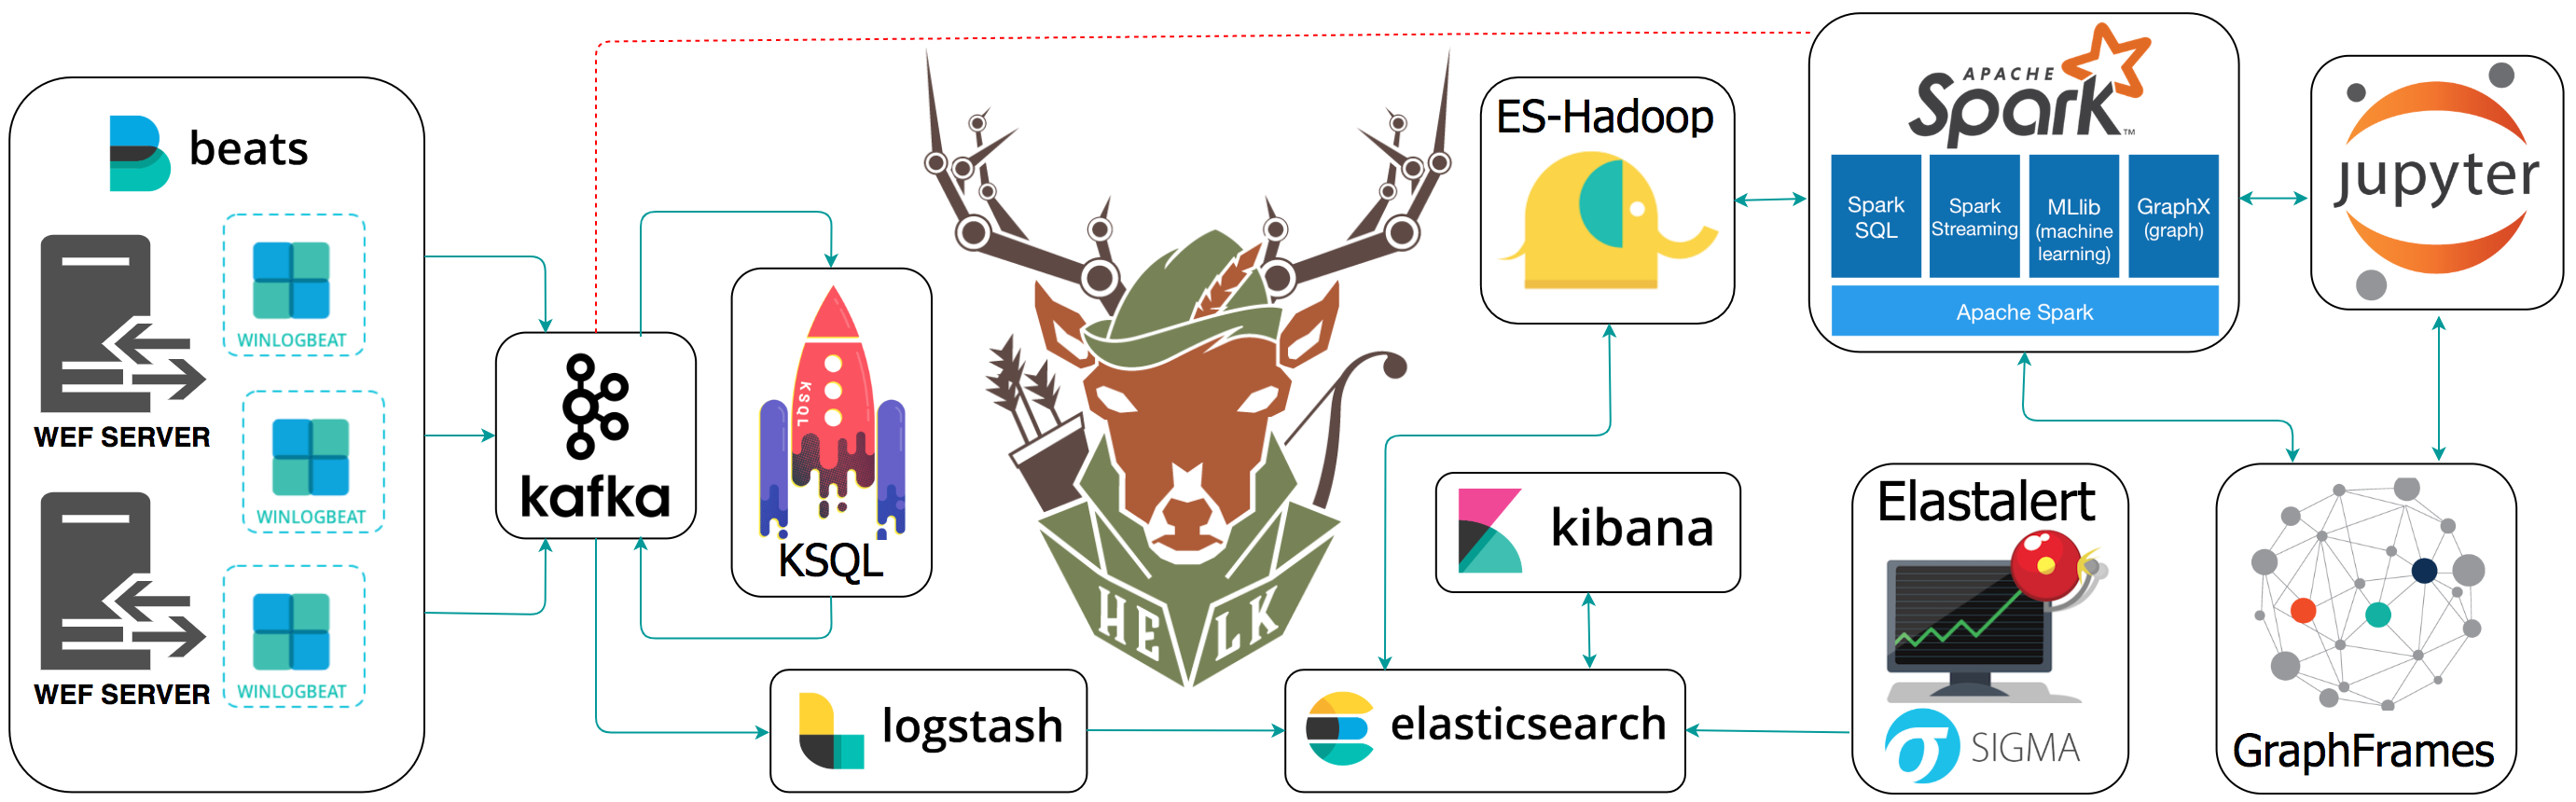
The Hunting ELK or simply the HELK is one of the first open source hunt platforms with advanced analytics capabilities such as SQL declarative language, graphing, structured streaming, and even machine learning via Jupyter notebooks and Apache Spark over an ELK stack. This project was developed primarily for research, but due to its flexible design and core components, it can be deployed in larger environments with the right configurations and scalable infrastructure.
Requirements#
Python : Python is a programming language that lets you work quickly and integrate systems more effectively.
Docker CE : Docker Community Edition (CE) is ideal for developers and small teams looking to get started with Docker and experimenting with container-based apps (Installed by HELK).
Docker Compose : a tool for defining and running multi-container Docker applications (Installed by HELK).
Install HELK#
Download the HELK. Make sure you have enough memory to run the basic build. You can run it with 5-6GB of RAM now (More information here).
$ git clone https://github.com/Cyb3rWard0g/HELK.git
$ cd HELK/docker
Update HELK’s basic docker-compose file. You just need to add the following right before ulimits. Similar to how it is set for the Logstash docker service
ports:
  - "9200:9200"
Run the HELK’s install script
$ sudo ./helk_install
Use the defaults (Option 1 and Basic license)
**********************************************
**          HELK - THE HUNTING ELK          **
**                                          **
** Author: Roberto Rodriguez (@Cyb3rWard0g) **
** HELK build version: v0.1.7-alpha02262019 **
** HELK ELK version: 6.6.1                  **
** License: GPL-3.0                         **
**********************************************

[HELK-INSTALLATION-INFO] HELK being hosted on a Linux box
[HELK-INSTALLATION-INFO] Available Memory: 12541 MBs
[HELK-INSTALLATION-INFO] You're using ubuntu version xenial

*****************************************************
*      HELK - Docker Compose Build Choices          *
*****************************************************

1. KAFKA + KSQL + ELK + NGNIX + ELASTALERT
2. KAFKA + KSQL + ELK + NGNIX + ELASTALERT + SPARK + JUPYTER

Enter build choice [ 1 - 2]: 1
[HELK-INSTALLATION-INFO] HELK build set to 1
[HELK-INSTALLATION-INFO] Set HELK elastic subscription (basic or trial): basic
[HELK-INSTALLATION-INFO] Set HELK IP. Default value is your current IP: 192.168.64.138
[HELK-INSTALLATION-INFO] Set HELK Kibana UI Password: hunting
[HELK-INSTALLATION-INFO] Verify HELK Kibana UI Password: hunting
[HELK-INSTALLATION-INFO] Installing htpasswd..
[HELK-INSTALLATION-INFO] Installing docker via convenience script..
[HELK-INSTALLATION-INFO] Installing docker-compose..
[HELK-INSTALLATION-INFO] Checking local vm.max_map_count variable and setting it to 4120294
[HELK-INSTALLATION-INFO] Building & running HELK from helk-kibana-analysis-basic.yml file..
Download Security Datasets#
Download the mordor repo and choose your technique:
$ curl -LJO https://raw.githubusercontent.com/OTRF/mordor/master/datasets/small/windows/credential_access/host/empire_dcsync_dcerpc_drsuapi_DsGetNCChanges.zip
  % Total    % Received % Xferd  Average Speed   Time    Time     Time  Current
                                 Dload  Upload   Total   Spent    Left  Speed
100  639k  100  639k    0     0  1797k      0 --:--:-- --:--:-- --:--:-- 1792k
Decompress the specific mordor log file
$ unzip empire_dcsync_dcerpc_drsuapi_DsGetNCChanges.zip
Archive:  empire_dcsync_dcerpc_drsuapi_DsGetNCChanges.zip
  inflating: empire_dcsync_dcerpc_drsuapi_DsGetNCChanges_2020-09-21185829.json
Ship Data to HELK#
$ mordor/scripts/data-shippers/Mordor-Elastic.py --url http://localhost:9200 inputs empire_dcsync_dcerpc_drsuapi_DsGetNCChanges_2020-09-21185829.json
If you are using a fresh HELK install, then you should not have hundres of events in a few indices. Without accessing the Kibana interface, you can simply access the helk-elasticsearch docker container and use its APIs to see data available in it:
sudo docker exec -ti helk-elasticsearch bash
[root@6f8ff404383a elasticsearch] curl http://localhost:9200/_cat/indices?v
Output Example:
health status index                                         uuid                   pri rep docs.count docs.deleted store.size pri.store.size
green  open   .monitoring-logstash-7-2020.09.04             0wtkIPo-RxCZ1qRzxQTBoA   1   0       1085            0     34.9mb         34.9mb
green  open   .monitoring-kibana-7-2020.09.04               O73EUP4iREu1ZhfKI9iFrQ   1   0          5            0     90.8kb         90.8kb
green  open   logs-endpoint-winevent-additional-2019.03.01  GKlzhBx5RAii6hlHe7aTmQ   1   0         21            6    110.8kb        110.8kb
green  open   .apm-agent-configuration                      HfOnH3kOQgacIKGUNJWq9w   1   0          0            0       283b           283b
yellow open   mitre-attack-2020.09.04                       IIc2OSzqQc6NVZnOfQx-dQ   1   1       8624            0     25.7mb         25.7mb
green  open   .kibana_1                                     TiRgVYzYTByIDTPmh8afNA   1   0        276            2    274.9kb        274.9kb
green  open   logs-endpoint-winevent-sysmon-2019.03.01      qpoKrgjCQHKaNGSyPzGAIQ   1   0        323           70    596.3kb        596.3kb
green  open   logs-endpoint-winevent-sysmon-1990.12.18      QywJ1MqmSxKT4jRK0BiynQ   1   0          1            1     55.1kb         55.1kb
green  open   .monitoring-es-7-2020.09.04                   plh8oVR1QomWHr0QxPTxag   1   0         17            1      1.1mb          1.1mb
green  open   .kibana_task_manager_1                        s5b-0WjHR4OgXNtITmqDJg   1   0          2            0       34kb           34kb
green  open   logs-endpoint-winevent-security-2019.03.01    wK9G1vP5Qiy9HLLn6Q2tIw   1   0        178          265      504kb          504kb
green  open   logs-endpoint-winevent-powershell-2019.03.01  CziOhDQnT3-KhWm1FjGbwg   1   0       4583            0     39.8mb         39.8mb
green  open   logs-endpoint-winevent-system-2019.03.01      kgVBuZiETjCQOZmyOhIlBA   1   0         62            4    201.1kb        201.1kb
green  open   logs-endpoint-winevent-wmiactivity-2019.03.01 Z_umc3lEQHyBfNWIRAcWFw   1   0         14            0     49.5kb         49.5kb
Additional Access#
If your HELK instance is only accessible via SSH, you can create port forwarding with the following command to access the Kibana interface:
ssh -N -L 8080:127.0.0.1:80 -L 4043:127.0.0.1:443 <USER>@<IP-OF-HELK-SERVER>
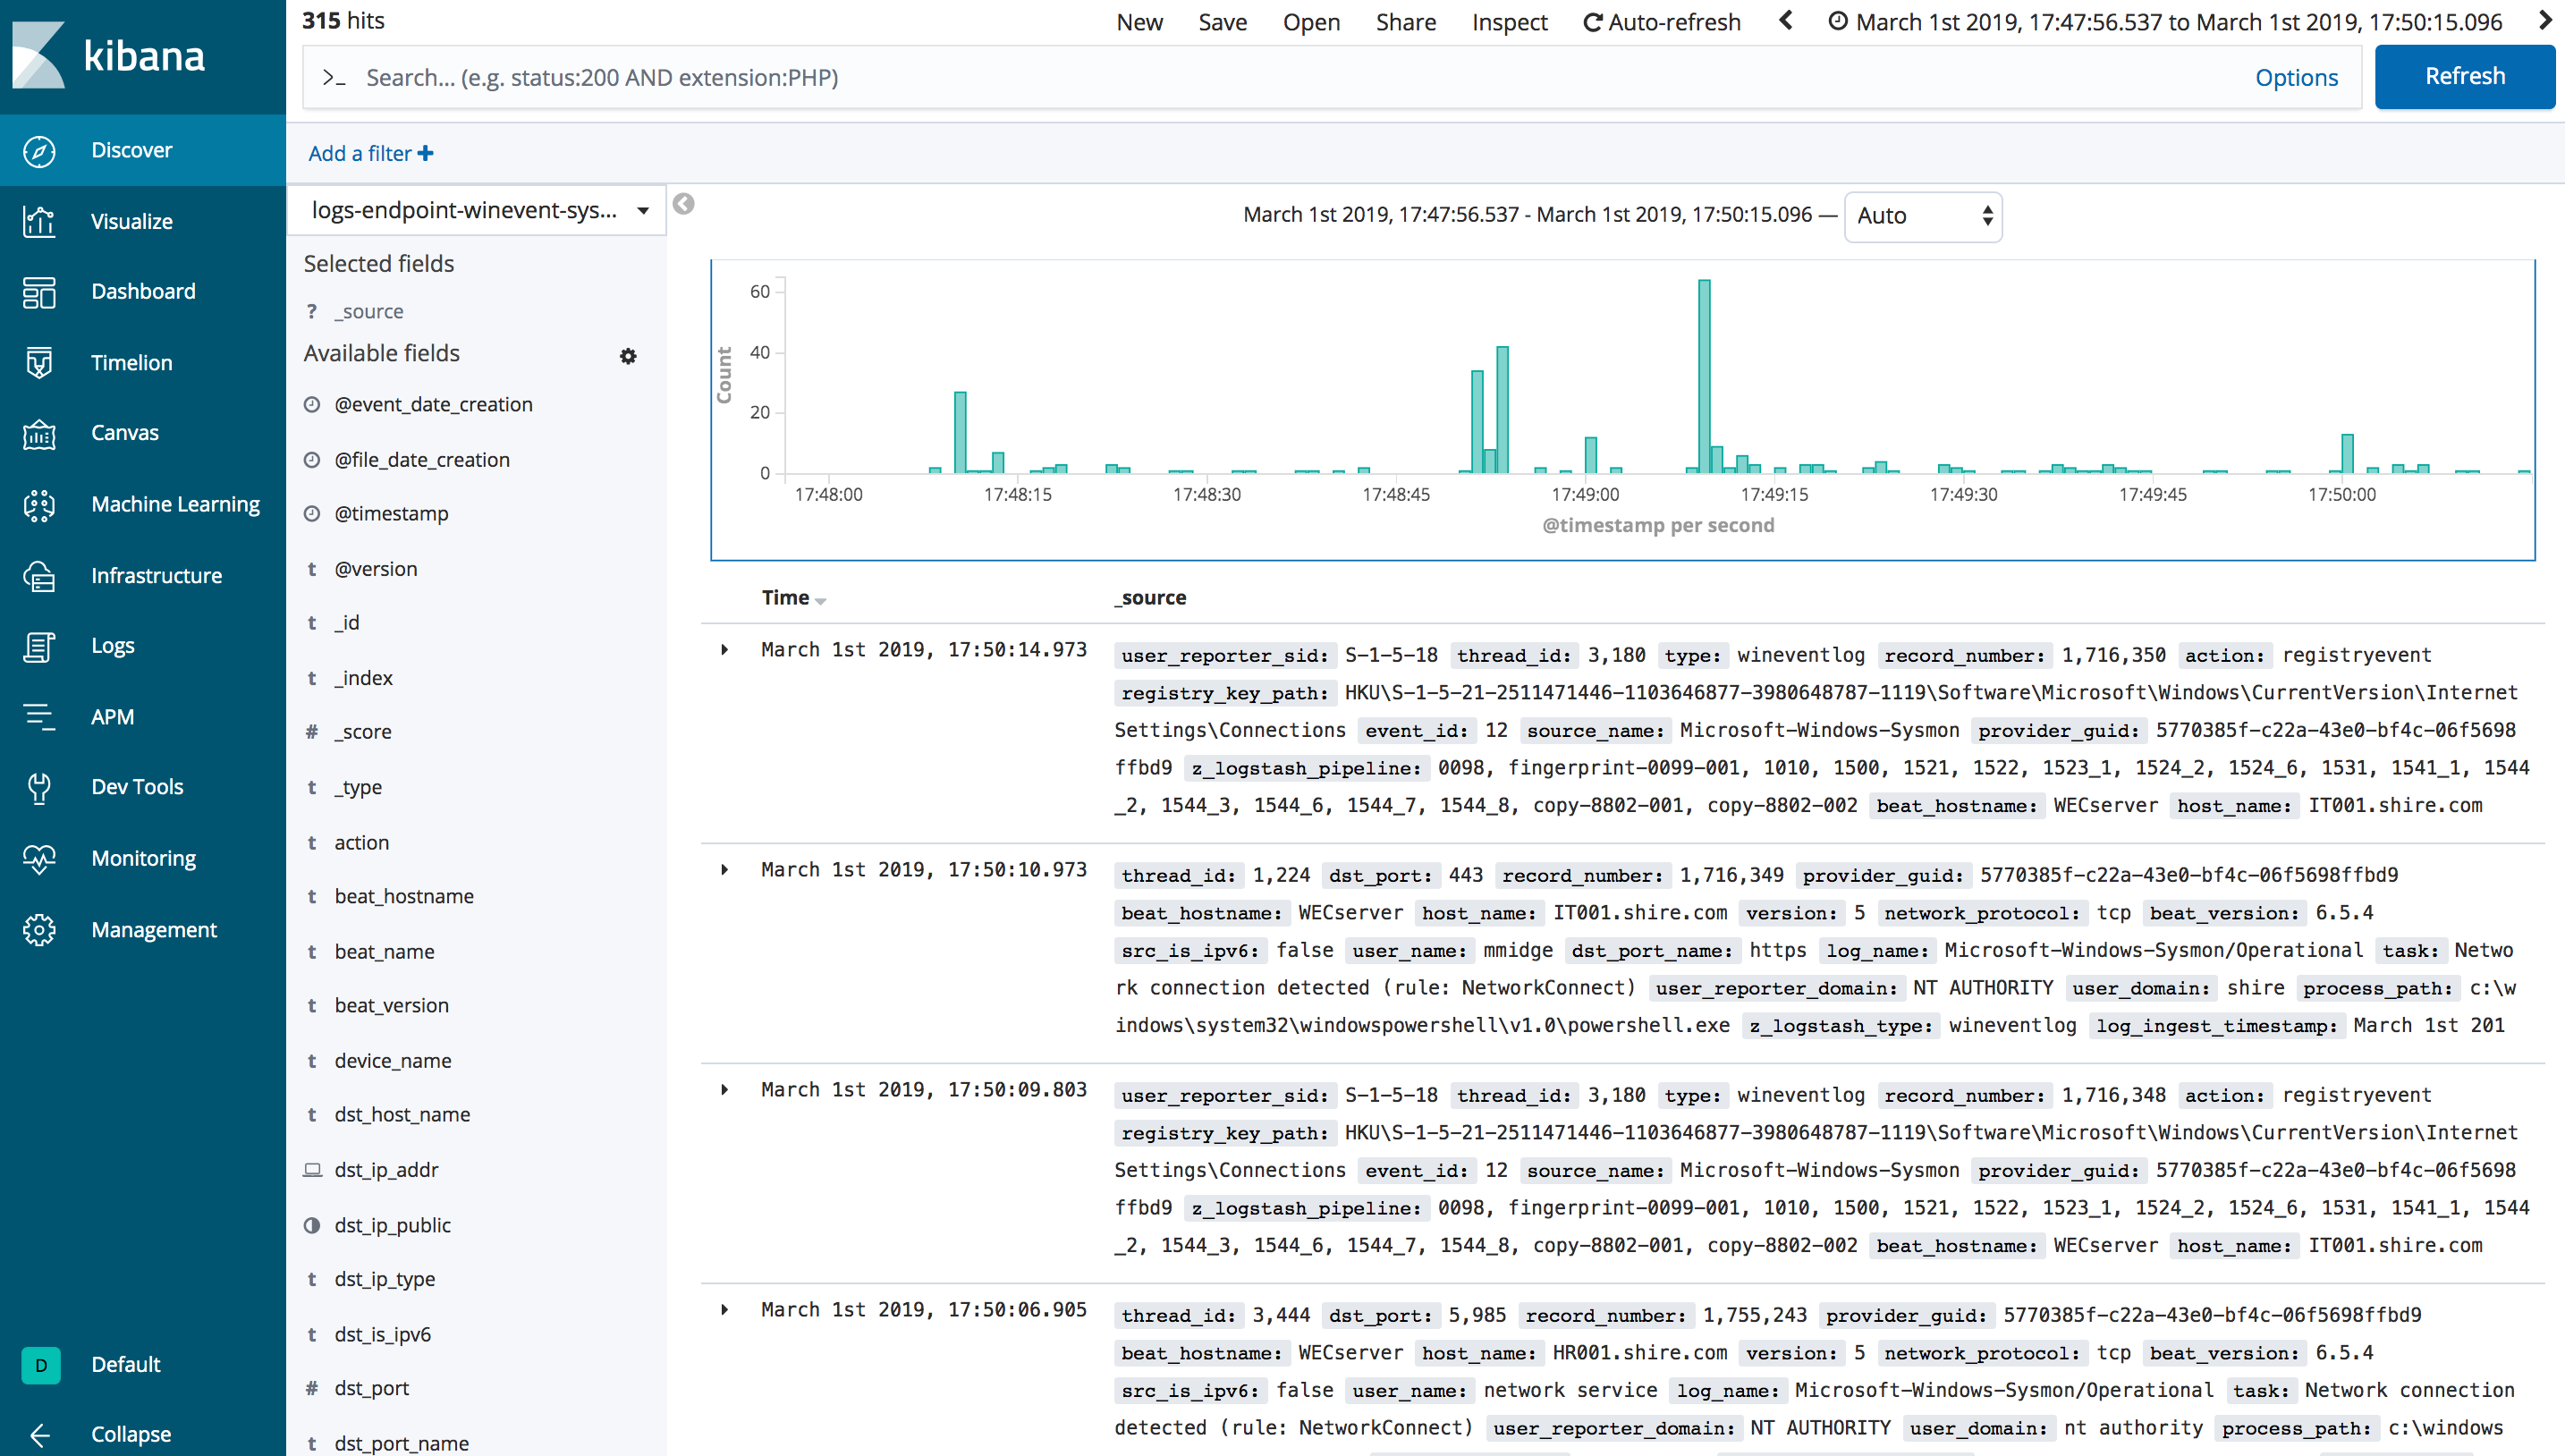
Explore Data#
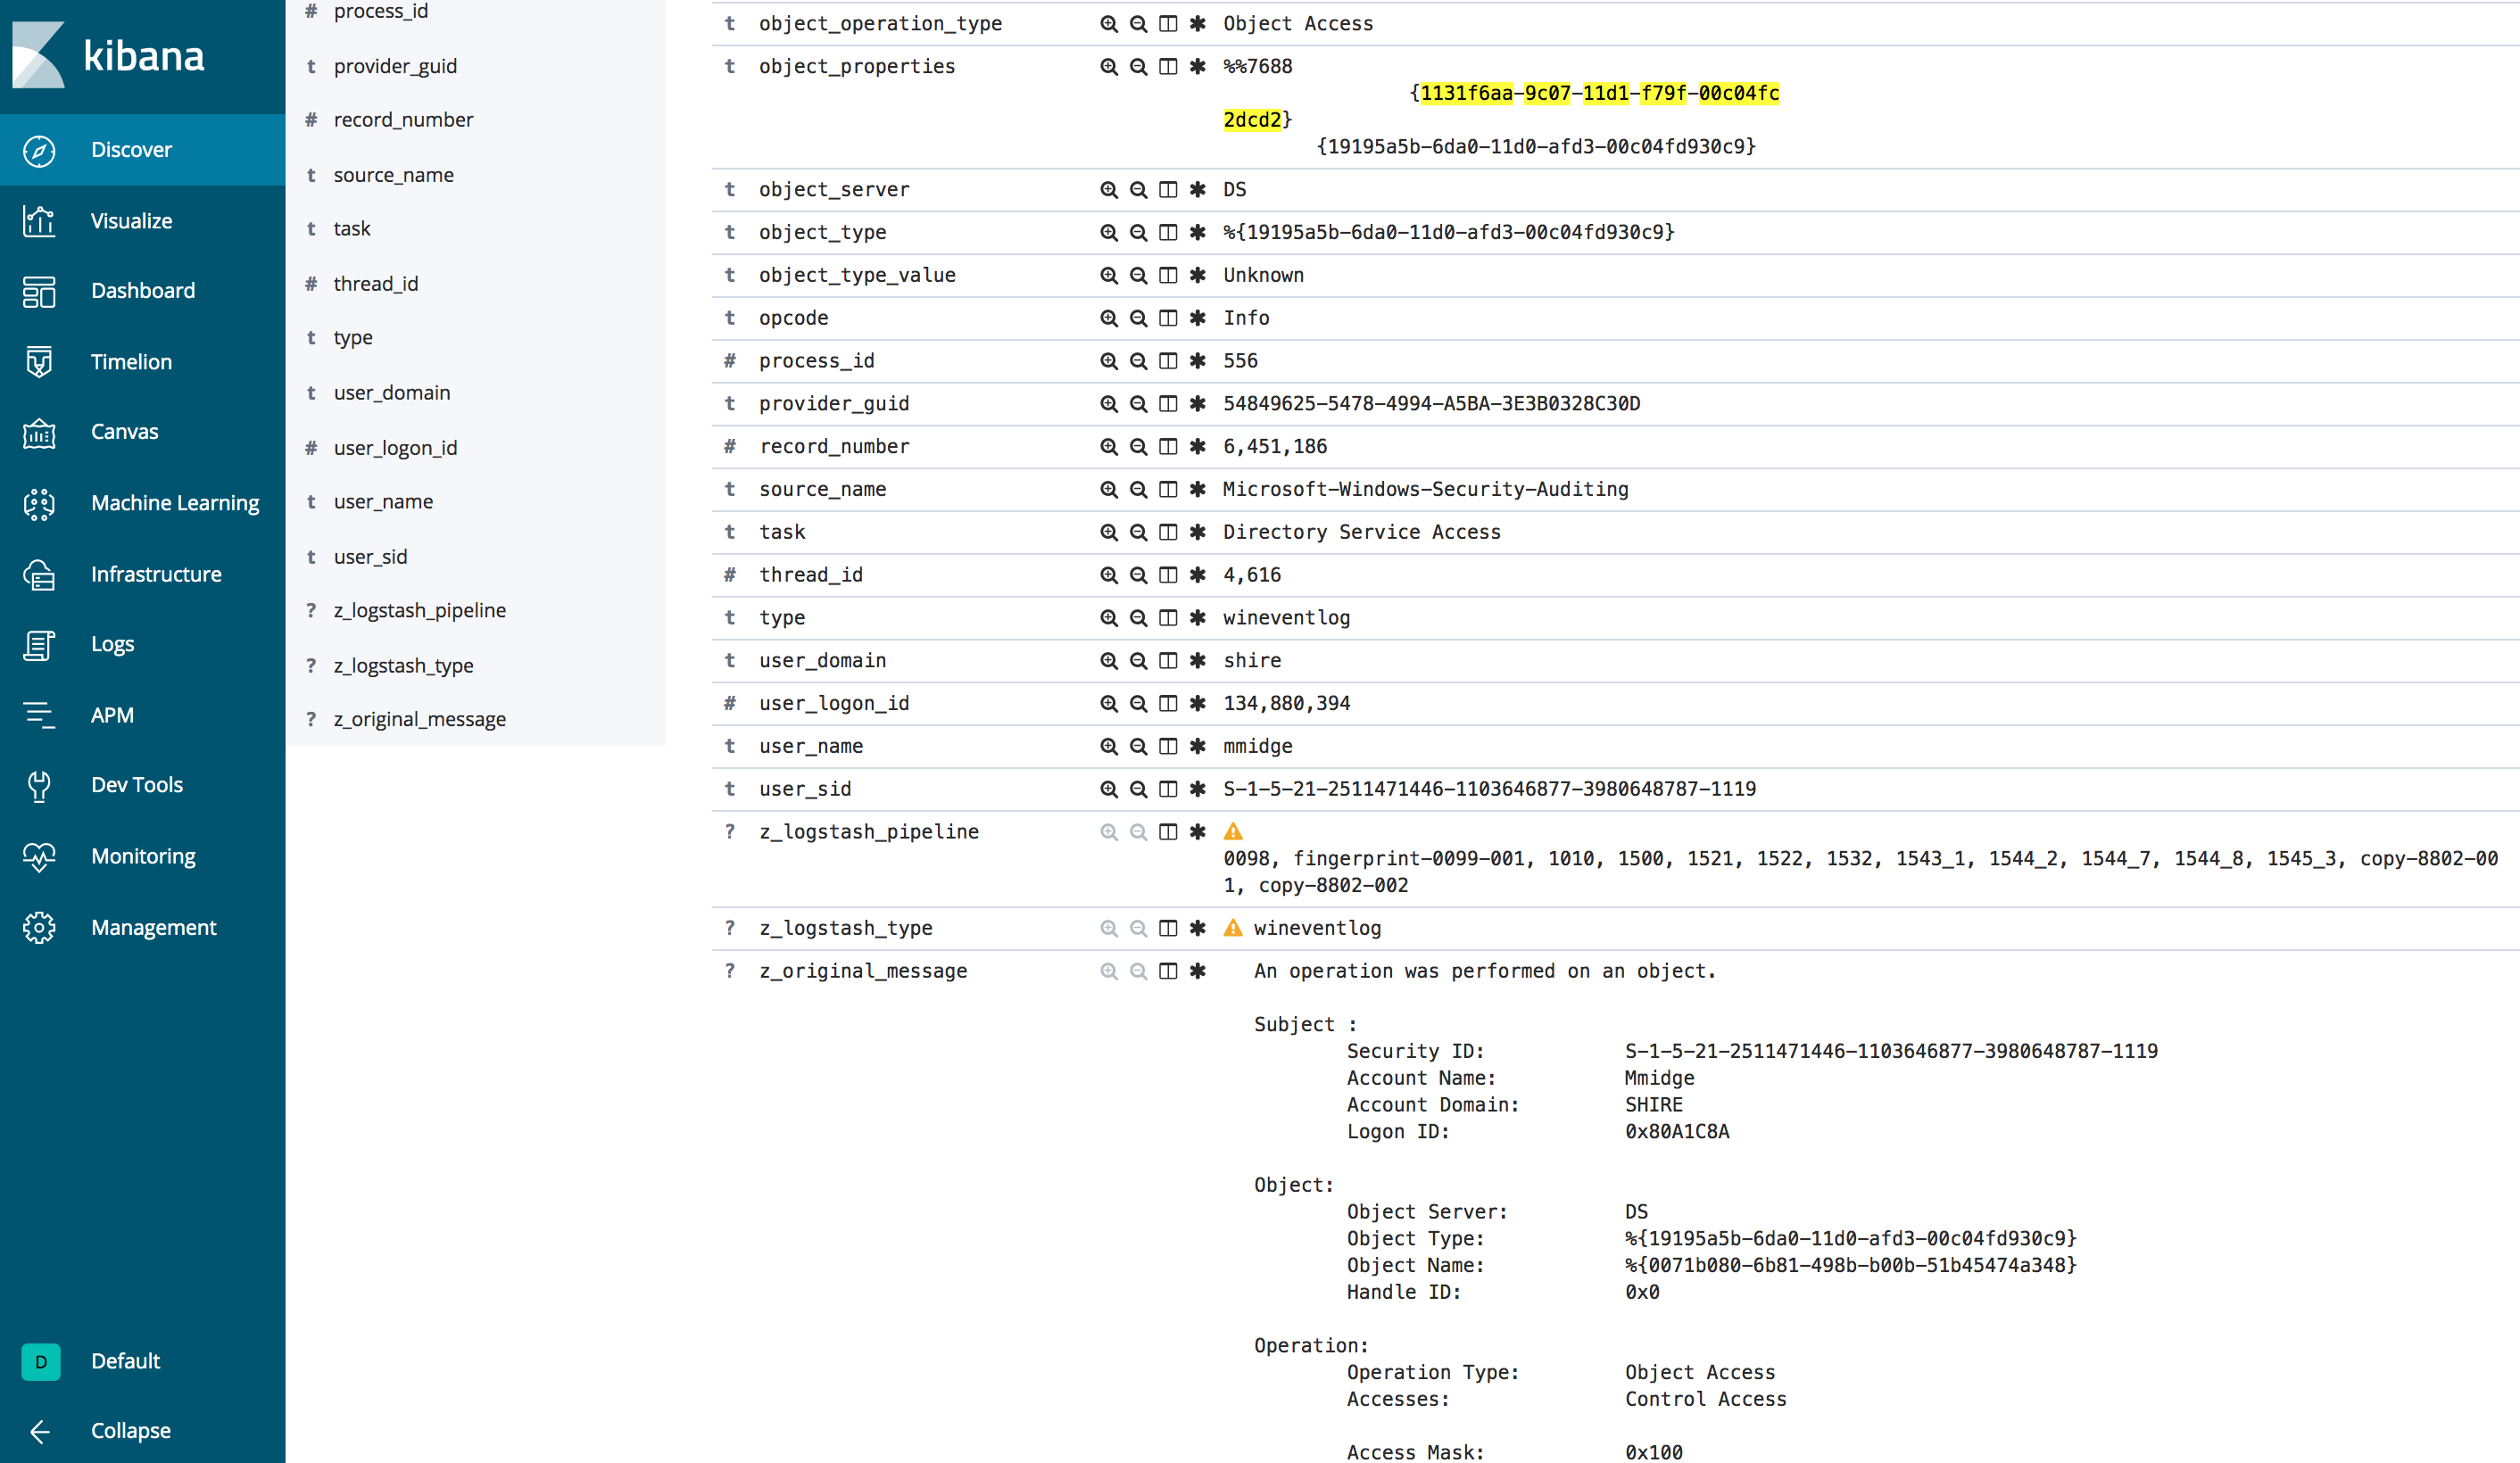
Browse to your Kibana Discover view and start going through the data
You could look for potential DCSync actvity from a non-Domain-Controller account with the following query in Kibana:
event_id:4662 AND object_properties:("*1131f6aa-9c07-11d1-f79f-00c04fc2dcd2*" OR "*1131f6ad-9c07-11d1-f79f-00c04fc2dcd2*" OR "*89e95b76-444d-4c62-991a-0facbeda640c*")